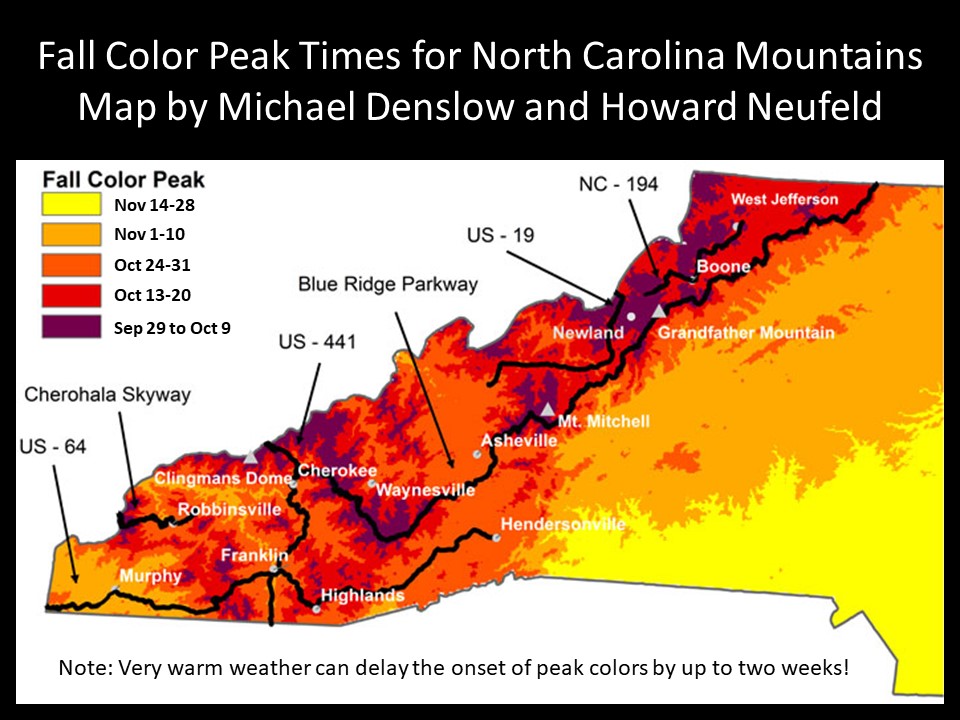
Conceived by Howard Neufeld and Michael Denslow
Map Constructed by Michael Denslow
This map above gives an estimation of the timing of fall color peaks for the various regions of North Carolina. If you have used our map in the past, you'll see that we have added two new features to the mountain section of our fall color map: towns and scenic roads. We hope these new graphics help you orient yourself as you decide where to visit in the North Carolina Mountains during our fall foliage season. This map differs from most other such maps because it combines the effects of both elevation and latitude on fall color, whereas most other maps simply use elevation alone.
We constructed the map using the following assumptions. First, we assumed that fall color would start earlier at higher elevations. We then figured (guessed!) that for each 1,000' increase in elevation, peak fall colors would occur about one week earlier, with the exception of those areas near the coast, where we divided the elevation into 500' sections.
For the latitude effect, we used data from published papers suggesting that each degree of latitude north is equivalent to going up in elevation by about 200 m (656'). This means that if you were to compare 3,000' down in Murphy with 3,000' in northern Ashe County (which are about 2.5 degrees apart), it would be as if you were really at 4,640' in Ashe County, at least fall color peak-wise. In other words, the same elevation in the north is cooler than the same elevation in the south, which causes the vegetation to differ. The resultant cooler temperatures mean that peak fall colors will come earlier to those same elevations in the north than in the south.
Thus, our map is among the first to take both elevation and latitude into consideration. However, it is only an approximation, and we would love to hear from any of you as to whether we have hit the fall color peak correctly or missed it. Over the next few years, we hope to "adjust" the map to better model the progression of fall colors throughout our state.
Thanks to Michael Denslow of the Department of Biology at ASU for creating this graphic.
